let´s go on with chapter 3 of Advances in Financial Machine Learning. The last chapter was about creating features for machine learning, i.e. bars in this case. Chapter 3 on the other hand is about labelling, which is necessary for supervised learning algorithms.
Fixed-Time Horizon Method: This method is probably the most common method of labelling financial data. Here, an observation is assigned a value int {-1,0,1} based on the return (r) in a specific time frame. For example, the observation will be labelled -1 if r < -theta (with theta being a specific threshold value), 0 if r <= theta, and 1 if r > theta. De Prado, however, mentions multiple reasons to avoid this method:
As seen in chapter 2 already, time bars do NOT exhibit desiderable statistical properties.
It does not make sense to apply the same threshold value theta disregarding other factors such as for example realized or implied volatility in the markets.
To solve these issues, some fixes are:
Labelling with a varying threshold value. This may be achieved with an rolling exponentially weighted standard deviation of the returns, for example.
As seen in the previous chapter, dollar and volume bars exhibit better statistical properties. Use these bars instead.
However, even adjusting for these flaws leaves out a crucial aspect that has to be considered: the path followed by prices. It is not realistic at all that the path would not be considered. It is not about if a profit is to be realized at some point. Rather, it is of utmost importance to label if one was stopped out earlier.
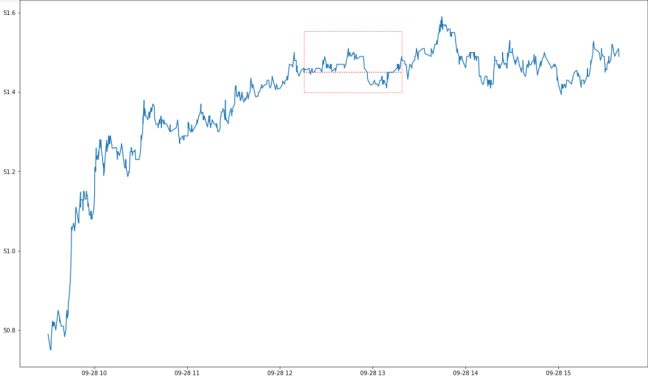
The Triple-Barrier Method: A labelling method proposed by De Prado that takes the path of the prizes into account is the triple-barrier method. This method labels a given observation according to the first barrier that was touched. There are three barriers in this method. Two horizontal barriers relate to profit-taking and the stop-loss. As introduced above, these two barriers are dynamic functions of volatility. Further, there is a vertical barrier which is related to a deadline or a time-stop. If the upper (Profit-taking) barrier is hit first, the observation is labelled 1. If the lower (stop-loss) barrier is hit first, the observation is labelled -1. Finally, if the vertical barrier (time-stop) is hit first, the label is either 0 or the return r.
The chart below shows the tripple-barrier method in action with the upper horizontal barrier being the profit target, the lower horizontal barrier being the stop-loss point, the left vertical barrier being the starting point of the bar and the right vertical barrier being the time-stop. In this case, neither profit-taking nor loss-taking is triggered and instead the time-stop is hit.
Side & Size of a Bet: ML algorithms can help us (i.e. learn) the side and the size of bets too. For instance, we would like to learn the side of a bet when a model to choose the side is not available. In this case it is impossible to distinguish between profit-taking and a stop-loss in the model. Consequently, the horizontal barriers will be non-existent or symmetrical.
Meta-Labelling: If the side of the trade is known, we still need to find the appropriate size of the trade. After all, trade sizing is a crucially defining factor. Here, meta-labelling enters the story. When meta-labelling is active, we know the side of a trade. Therefore, we may distinguish between profit-taking and loss-taking and the horizontal barriers do not have to be symmetric. The ML algorithm will be trained to decide whether or not to take a specific trade (0 or 1). Then, the probability of the prediction may be used in the sizing decision.
Such binary classification problems represent a trade-off between type-I (False Positives) and type-II (False Negatives) errors. Evaluation metrics for these kinds of errors are Precision (True Positives/(True Positives+False Positives)), Recall (True Positives/(True Positives + False Negatives)), Accuracy ((True Positives + True Negatives)/(True Positives + True Negatives + False Positives + False Negatives)), and the F1-score (measuring efficiency of the classifier as average of Precision and Recall). Meta-labelling is a good approach to obtain a meaningfully high F1-score. Here, as a first step, a model with high recall is built and then meta-labelling is applied to correct for the low precision. As De Prado states “The role of the secondary ML algorithm [Meta-labelling] is to determine whether a positive from the primary (exogenous) model is true or false. [] Its purpose is to determine whether we should act or pass on the opportunity that has been presented. “
Further, four main advantages of Meta-labelling are:
It may be a substitute to fundamental analysis leading to the quandamental way of investing.
Because the ML algorithm does not decide the side but only the size of the bet, overfitting is limited.
Because decisions regarding size and side are separated, “sophisticated strategy structures” are possible. This relates to different strategies on the short and long side.
As De Prado states “achieving high accuracy on small bets and low accuracy on large bets will ruin you.” Therefore, the ML algorithm of meta-labelling focusing on this sizing aspect is truly crucial.
Communicating these concepts in words is rather difficult. As for chapter 2, applications and solutions to the exercises will be available later on my github page:
recently I listened to a terrific podcast between Jesse Felder and Diego Parrilla. Mr. Parrilla mentioned how crucial it is to write down one’s thoughts on a thesis. This is exactly what I want to do with this blog post. Basically, I want to write about a story that I have been following for quite a while. It seems to be one of the few value-stories out there. The more I learn about the situation, the more compelling the opportunity seems to me. This post will be about the Uranium sector. I will write about a small niche commodity which is one of the most important energy sources in the world.
Basically, I write this down completely for the purpose of reflection and ordering my thoughts. I want to see if I can formulate the bullish Uranium thesis. Have I have at least partially understood the story, and can I lay out the thesis? We will see.
As a warning I want to mention that I have not researched the Uranium sector in depth myself. I am no commodity analyst. Admittedly, my understanding of this industry is very limited. What I want to do however, is summarize the reports and publications that I have studied and outline the bull case for Uranium – even without mining expertise. The most important sources I rely on include Kevin Muir´s TheMacroTourist, Goehring & Rozencwajg, Adam Rodman, Rick Rule, Marin Katusa, Mike Alkin, John Quakes and Amir Adnani. These sources are all Yellow Cake (the form of Uranium I´m talking about) bulls. Further, some of the arguments have been made for over 3 years. Thus, my story is bull-biased and while the outcome seems to be inevitable I am not certain that it is imminent. However, the resource sector in its nature is extremely cyclical and as is said “bear markets are the authors of bull markets and bull markets are the authors of bear markets”. So, let´s look into the story.
The Uranium story may be the ultimate contrarian play. There seems to be almost no commodity that is universally as hated as Uranium. Not just environmentalists hate Yellow Cake. Rather, the prolonged bear market has made investors reluctant to even consider the commodity.
History has seen three big Uranium cycles up to date. The first big bull market took place during the 1950s as a result of the nuclear arms race. Then, in the 1970s when the oil shocks hit nuclear energy became more prominent and desirable. Finally, the last bull market burst with the outbreak of the financial crisis in 2007 after Uranium had reached a spot price of 136 US$/lb.
Since then, the market has experienced a prolonged bear market. Nevertheless, before the Fokushima catastrophe, the spot price was still in the range of 70 US$/lb. However, the Fokushima incident and the resulting public sentiment shift marked the beginning of a new 8-year long bear market. After the catastrophe, globally policy makers in countries such as Germany vowed to take reactors offline. In Japan alone, 54 reactors shut down. Since then assets in the sector have been trading at depressed levels. Valuations are amongst the lowest of any industry. Uranium spot prices fell over 80% at some point and many miners and producers lost over 90% in equity value. Uranium companies have since belonged to the very most distressed companies one may find in the resource business. In fact, the sector has been decimated. Global market capitalization declined from 130 billion US$ pre-Fokushima to 10 billion US$ post-Fokushima. In the same time frame the number of companies operating in this business decreased from 500 to around 40 nowadays.
Source: Cameco
While asset assets are valued at the lowest valuations in history, the stigma about the nuclear industry is at a high. Ever since the catastrophe in Fokushima the perception of the nuclear industry has been that of a dying one. Being German, I can testify how quickly sentiment has changed in the aftermath of the Fokushima incident.
However, this stigma around the word “Nuclear” is what creates this investment opportunity in the first place. People fail to make a distinction between nuclear enrichment for weapons and energy, which is fundamentally different.
Nuclear energy still is one of the cleanest, cheapest, most efficient, most reliable and by some, admittedly arguable, measures safest energy sources. We find ourselves in times of depressed prices, no interest and even hate directed towards this industry. At the same time fundamentals are changing rapidly towards the positive. This is exactly what makes the outlook so compelling.
The big deal is that we find ourselves in a situation in which uranium producers just can´t make any money. None! But first let us have a short look at the global production divide. Globally, there are just a handful of meaningful Uranium mining locations. The most important countries are Kazakhstan with a market share of around 40%, Canada with a market share in the range of 22% and countries less significant for production such as Australia, the United States of America and countries located in Africa. Given this situation, Kazakhstan and Canada basically dominate the Uranium market. We may consider them like OPEC on steroids, even though there is no cartel. The most significant Uranium producers in these two countries are Kazatoprom in Kazakhstan and Cameco in Canada. These two companies globally belong to the global very low cost producers. Interestingly, as we will see later, both recently cut production due to prices being uneconomical. These production cuts as a percentage of global supply were of a size that would make OPEC jealous.
But why is it not economic for virtually any miner in the world to mine Uranium under current conditions? Well, it is about the price of Uranium on the one hand and the cost of production on the other hand. Let us have a look at the marginal cost curve against spot prices. At the time of writing, the spot uranium price is less than 30 US$/lb. This price includes a considerable increase from the mid 20s in 2018. The average cost of production on the other hand is around 55 US$/lb. Yes, even after the rebound in 2018 spot prices still need to double for companies just to break even. The spot price needs to rally 100% just to reach the global marginal cost. This seems like a rather surreal situation. And indeed, it is. One may expect miners not continue operations when losses are made. If companies can´t even meet marginal costs, production will be reduced. This should be a logical conclusion.
This takes us back to Cameco and Kazatoprom, the duopoly that I just introduced (which we may call OPEC squared). Both companies recently have cut production. Most notably, in 2017 Cameco temporarily shut down its mine McArthur River. This shut down later was made indefinite. This shutdown is remarkable because of two reasons. First, McArthur River is one of the lowest cost mines in the world. If this mine is not economic, then virtually no mine is. Secondly, with McArthur River´s shutdown, 15 million pounds of around 160 million pounds of global annual production, or around 10% of global annual Uranium supply was taken offline. Yes, 10-11%! This is a big deal. Oil markets go crazy when OPEC announces comparably small production cuts. Uranium production on the other hand decreases significantly and no one talks about it. The shutdown of McArthur River is remarkable by a further yardstick. Because of contractual obligations, Cameco still needs to provide more Uranium to utilities than it produces. At present prices it is cheaper for the company to buy this Uranium spot in the market than mine it itself. You may reread this sentence again. It is cheaper for Cameco to buy Uranium at spot prices than to mine it itself! This on the other hand, brings in an additional spot buyer in the market. We will revisit this point a little later. Besides Cameco, Kazatoprom has been cutting production too. With these two giants decreasing mining activity, we may enter Uranium deficits much earlier than anticipated.
We see that Uranium at current prices is not sustainable. As any other commodity, Uranium has a tendency to move towards its marginal cost of production. Even when this price is reached, given current under-investment in the industry, not a lot of new supply will be able to come online quickly.
But why have miners continued to produce at all at these prices? As we will see, the important aspect and possibly the catalyst to change current market conditions is the contracting cycle in the Uranium sector.
In the Uranium market, there are two types of markets. Firstly, there is the spot market for the commodity. The spot price is what is publicly observable. It refers to the chart above and is the reference point for the price of Uranium. However, the spot market is less relevant for the industry than one may think. It is rather a measure of the overall market sentiment. However, the economics of the miners is not about the spot market but rather about the contract/forward market. Miners and Uranium producers generally do sell Uranium forward to utilities. The forward price is more abstract, or at least not publicly observable. In the Uranium markets, these forward contracts are agreed upon in long-term cycles of 7-10 years. This explains, why miners have been able to survive up to this point. They still have been paid according to forward contracts signed in the past instead of the depressed spot market price.
For utilities, supply safety of Uranium is of utmost importance. Hence, generally utilities do not source in the spot market but rather in the forward market. The fact that miners and utilities interact in the forward contract market, and that contract cycles are of long-term nature is of special significance now. This is because one may expect many contracts to expire in the close future. Indeed, many contracts did expire already in 2017. Therefore, a new contracting cycle is about to start. This new contracting cycle may be the catalyst for Uranium to move. Given spot prices that need to rally 100% just to meet the marginal cost, no miner will sell Uranium forward at these prices.
A new contracting cycle for both existing and new reactors will eventually bring a new wave of demand into the market.
Thus far, utilities have been passive. In 2018, virtually no new contract volume was made available. After a prolonged bear market, investors and energy producers are still skeptical. There is another reason for the delay of the new contracting cycle however. This reason is called section 232. Under section 232 in the United States the Department of Commerce may take action to protect domestic industries from international supply. Currently, tariffs on foreign Uranium are considered. This is especially interesting when considering the fact than about 95% of US Uranium is imported. However, currently this situation puts utilities in a holding position. The US ruling is and thereby certainty as to where Uranium may be sourced is awaited.
When considering the demand of utilities, two main aspects have to be taken into account. Firstly, security of supply is of utmost importance for utilities. Currently, the start of the new contracting cycle may have been delayed due to low spot market prices, existing inventories and the awaited US ruling. However, one may expect utilities to start sourcing to secure supply soon. Secondly and even more important, utilities are very inelastic buyers. The cost of Uranium is a very small percentage of overall cost of operating a nuclear reactor. Therefore, Uranium prices virtually do not affect the behavior of this giant inelastic buyer at all. There is almost no Uranium price that this buyer would not pay. On the other hand, the buyer does not step in and buy more Uranium at depressed levels either. This is what makes the low-cost commodity Uranium such a hyper cyclical commodity.
Even if the start of the contracting cycle is further away than expected, one additional factor will support spot Uranium prices in the future. As already mentioned above, it is now cheaper for miners to buy Uranium which they are contractually required to supply in the spot market than mine it themselves. After having closed the world´s biggest mine at McArthur River, Cameco is one example of additional demand in the spot market. As price fundamentals further deteriorate, more production will be taken offline. Instead, the spot market will serve as opportunity to buy material. This demand will put a natural floor on Uranium prices until the contracting cycle starts again. Since the spot market is very thin, this is somewhat of a self-fulfilling process. To use the words of Warren Buffet and Benjamin Graham, we may even speak of a “Margin of Safety” here.
Even though the western media does not project this feeling, looking at the demand side of Uranium, one encounters much upcoming demand. Globally, there exist around 500 reactors, with 60 under construction and close to 190 new projects.
Traditionally, the center of nuclear power has been the west. The United States still has the largest fleet of reactors and countries such as France and Japan were strong advocates for nuclear energy for a long time. Post-Fokushima, the tides have turned a little bit with Japan taking reactors offline and Europe turning its back on the industry. In the west, many former supporters question this energy source nowadays. However, more importantly demand from new players is coming into the markets (while there will remain considerably demand from the old elite too).
Especially emerging markets lead growing demand. There is a strong necessity for this kind of energy in China, India and other countries such as South Korea. The developing world needs nuclear power to keep up with its energy demands. Nuclear energy is rather clean and reliable. Given the dire need to reduce carbon emission, if lights are to remain turned on nuclear energy is a necessity. While renewable energy sources will gain foot in the future, the fact that nuclear energy is always on (unlike solar or wind) is crucial for EM energy security. Exemplary, in China annually an expected 500 thousand to 1 million people die of causes related to air pollution. China´s commitment to decarbonize most likely will be of nuclear form. Currently, in Chine there exist 45 running reactors with 15 under construction. By 2030 however, this number is to increase to 111. Generally, there is quite a backlog of new reactors that will come online in China, India, the middle east and other emerging markets. However, the demand side has been underestimated not merely for EM. In France, the phasing out of nuclear energy will be delayed and Japan is bringing back some of its reactors too. Consequently, demand for the next decades seems to be secure.
Besides the utilities demand, there is another form of demand that is interesting. In the last years financial demand has entered the market. This financial demand is about investors buying and holding uranium. Yellow Cake plc form the UK is an example of such an investment vehicle. Obviously, the uranium purchased by these investors is taken out of the market. This is especially noteworthy if one remembers the extreme thinness of the spot Uranium market.
Finally, there is one US centric perspective that must be investigated when analyzing the Uranium market. As mentioned earlier, world Uranium supply relies heavily on Russia. Russia and “Russia friendly” countries account for 65% of global supply. Russia itself accounts for 45% of global enrichment capacities. The united states on the other hand imports 95% of its Uranium demand oversees and 50% from Russia linked countries. Currently, the United states merely has a stock of 12 months of Uranium supplies. considering the growing tensions between the West and Russia, energy safety in the United States seems to be at risk given this situation. This is not merely a theory. In the midsts of the tensions between Russia and the US, Russia did consider banning Uranium exports to the US at some point. One may interject that there is production capacity in countries such as Canada or Australia. However, producers there partly are in long-term contracts with China and India and, as elaborated on earlier, there is no ease in bringing on new production quickly. To incentivize domestic production in the US, spot price will need to increase. And as indicated above, the Trump administration is considering protection the domestic industry increasingly under section 232.
In summary, the Uranium story is very attractive because we face a commodity trading in the spot market below the marginal cost. To incentivize future production, prices have to increase. Currently, we are in the very depressed stage of the Uranium cycle. However, the hypercyclitality of this commodity is what makes the investment so appealing. Let´s remember that the demand for this commodity is very inelastic. Given the small proportion that Uranium has in the cost structure of running a nuclear reactor, one faces a buyer that basically is forced to buy, at almost any the price. Since Fokushima and the change in sentiment, globally there has been very little CAPEX. This situation contrasts increasing demand in the next decades however. Therefore, when the market goes into deficit in 2019/2020 for the first time since the 1980s, deficits will matter a lot in the context of inelastic demand and energy safety. Even if we only see prices go up slightly, margins for some producers may improve considerably.
Of course, there are risks to this thesis. Firstly, a further nuclear disaster would be a disaster for nuclear energy. Secondly, Chinese demand is a key input into the demand equation. If for some reason Chinese demand were to decrease, the thesis would be less weakened too. Thirdly, given existing inventories in utilities, a further delay of the contracting cycle would delay the bull market. However, given the importance of supply safety this seems unlikely. Further, given the thin market there almost seems to be a natural floor to the price.
Currently, I am not sure what the best investment opportunity is to play this bull story. I guess one may want to invest in the lowest cost producers in good jurisdictions. However, I will do more due diligence on this in the next weeks.
Writing this story, I realize that I really only have started to get a feel for this bull case and the investment opportunities. Obviously, I am bullish and very biased by my sources. However, I take this blog entry as a starting point to learn more about this great opportunity.
Recently, I heard or read somewhere that the best way to learn something is twofold.
Explain the topic to someone else.
Write down your thoughts. This forces you to express your understanding in a concise manner and consequently shows if you really do understand the concept.
That´s why I have decided to again write more about the things I am learning about.
Currently, I am studying Marcos López De Prado´s great, yet for a machine learning novice like me also challenging, book Advances in Financial Machine Learning. In the following months, it is my plan to introduce some summaries about the concepts covered in the book.
After an introductory first chapter, the second chapter of the book introduces some interesting approaches I had not heard about before. Firstly, the topic of “bars” is covered.
On this blog, I generally aim to explain the theory proposed in the book. Code implementations and tentative solutions to exercises of the book will be implemented on my GitHub page soon: https://github.com/Herrsosa/Advances_F_ML
Bar Types
There are various types of bars in finance. Each bar has different advantages and disadvantages and even more importantly special statistical properties. Probably the most famous and most used type of bars in the trading community are time bars, which are sampled according to specific time frames, i.e. one minute, five minutes, one hour etc. De Prado argues, that in machine learning these bars are not desirable because of two reasons. Firstly, the market action throughout a given day does not flow at a constant rate of time. Rather, the open and close are usually much more volatile than the time during noon for example. Therefore, conventional time bars oversample low-activity, low-information times. Secondly, time bars exhibit poor statistical properties. They are often serially correlated and are subject to heteroscedasticity.
Below, you see one minute time bars throughout the day on the S&p 500 ETF SPX. Each minute, one bar is created
The next type of bars, tick bars, partly addresses these issues encountered when dealing with time bars. Tick bars establish a proxy for the arrival of information. A bar is created every time a predefined number of ticks has been reached. If a lot of information hits the market, more ticks and consequently more bars result. Therefore, these bars circumvent the constant market flow problem because bars are sampled at the rate at which information flows. Further, the statistical properties are better than for time bars. However, the possible fragmentation and number of the ticks introduces some arbitrariness. Is there more information in five one-share trades than in one five-share trade?
Volume bars address this issue of fragmentation. Here, bars are sampled whenever a given volume of shares has been traded. Even more robust than volume bars are dollar bars. The gist is than whenever a given dollar amount (or other currency) is reached, a bar is created. This makes intuitive sense because the dollar value of an asset changes over time. However, volume bars fail to account for this change in value. Dollar bars on the other hand are robust to this change or a change in the number of shares outstanding. Therefore the number of dollar bars over time is much more constant than the respective number for time or volume bars.
Next, I will have a look at so called information driven bars. These bars are based on the concept of market microstructure and aim to capture the occurrence of “informed trades”. As a comparison, the concept is similar to day traders watching an imbalance between red (bearish) and green (bullish) ticks on the time and sales tape. An imbalance may indicate information or other microstructure effects.
De Prado presents various imbalance bars. I will shortly introduce these without elaborating on the mathematical derivation. However, as mentioned above, there will be continuous applications of the topics covered on my GitHub site.
Tick Imbalance Bar (TIB): A tick imbalance bar is created whenever the imbalance of ticks exceed given expectations, where imbalance refers to an imbalance between ticks with a positive or negative price change. Accordingly, tick imbalance bars occur frequently and quickly when informed trading takes plays. We may therefore conclude that are candles which all contain the same amount of information.
Volume/Dollar Imbalance Bar(VIB/DIB): These two types of bars share the same idea. As tick imbalance bars, volume and dollar imbalance bars are related to order flow imbalances between bullish and bearish ticks. A bar is sampled whenever the volume or dollar imbalance exceeds a given expected threshold. Unlike TIBs, VIBs and DIBs do not depend on a constant bar size but adjust dynamically. Therefore, they are robust to corporate actions.
Runs bars monitor the sequence of trades in the overall volume of the ticks. Here, a bar is sampled whenever the length or accumulation of positive or negative ticks is especially large. The imbalance itself is not of importance here. Rather, the maximum of the length of positive of negative ticks is what these bars are looking for. As before, runs bars may be applied broadly. There are tick runs bars, volume runs bars and dollar runs bars to express various concerns.
That´s it so far for this entry.
Now, I want to try to implement these bars with code.
Last Friday was a pretty good trading day. I waited for my opportunity and executed it when I saw it.
I only traded on ticker, PRAN (Prana Biotechnology Limited, Biotechnology Sector). After an unjustified move on this low float stock on Tuesday, I eyed to short PRAN. When I noticed pre-market that a well-known chat pumping trader was about to buy PRAN, my conviction was even stronger. My plan was to wait for the open and short after a possible stuff move into $2.6/2.7.
The stuff move came and PRAN dropped from a high of $2.91 to as low as $2.55. Having learned from my past mistakes, I did not want to chase this unwind. I planned to scale into my position. I shorted 1/2 position at $2.65 and the other 1/2 at $2.7 into the VWAP move. PRAN did end up bouncing more and I honestly was lucky that my stop above $2.8 was not hit when PRAN hit a high of $2.79. However, this lower high was all that PRAN could do and it was weak for the next hour. I covered 1/2 of my position into the wash at $2.54, covered 1/4 at $2.55 a little later and finally covered the last 1/4 at $2.46.
I am quite satisfied with this trade. Even though I eventually want to enter more aggressively on the stuff moves, I am happy about how I followed my plan in both scaling in and out of this trade.
Given my goal of improving consistency and R/R this day receives a B-.
after a weak of sitting on the sidelines, I´m finally back. Monday & Tuesday I did not put on any trades. Wednesday was the 4th of July holiday and this morning I did not see a lot that interested me either.
Later in the morning however, a chat room pump helped me out of this misery.
CCCR (China Comercial Credit Inc., Credit Services) announced the entering into a non-binding letter of agreement with Lexiang Technology according to which CCCR will acquire 100% of the outstanding shares of Lemon Green Inc. “non-binding” & “letter of intent”? You see, these were no news of considerable substance. CCCR started a meteoric ascend however, hit the circuit breaker halt and reached a high of $1.68 from around $1.15 earlier in the morning. Directly after hitting its highs, the unwind followed and CCCR flushed below VWAP. I located shares and promised myself to be patient. Since CCCR seemed very weak, I put in my short order at $1.43. I indeed get filled and CCCR bounced up to VWAP – I was too early again. VWAP rejected however and the bagholders took over. CCCR experienced one red candle after another one. I took half my shares off at $1.33 and the other half at $1.28 just before a washout to $1.24
It is good to be back with a win. As so often however, my entry still was too early. Furthermore, given a stop above $1.50, a basically had a R/R of 1. I keep referring back to this issue and I am still thinking about how to improve this flaw.
Today´s trading was quite good and I´d give myself a C given my goals of improving consistency and R/R.
even though I should have written this report card daily, something happened last Tuesday that made me rather reluctant to trade for the rest of the week or even review my trades. A few days later, here I am, and I think it is very important to review what happened.
Last week it seemed as if every low float stock went parabolic. News? Not needed! Strong fundamentals? Who needs that? If there was a sub 10 million float, it was very likely that the stock was to be manipulated. However, being aware of these manipulations, traders obviously have to manage risk accordingly and I failed to do so on Tuesday.
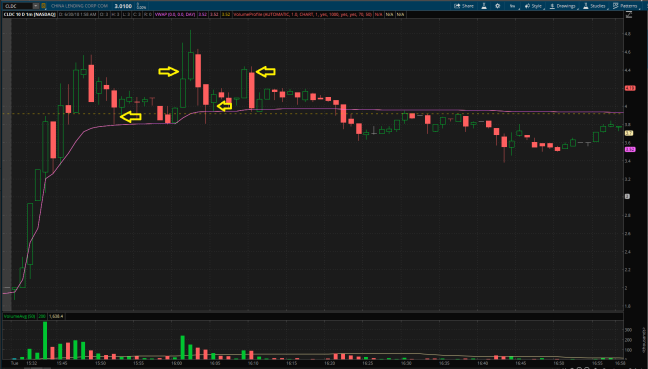
One of last week´s hot stocks was CLDC (China Lending Corporation, Financial Sector). Not having seen any volume and volatility in previous weeks, this is what the stock did last week.
Tuesday, on day 1, there were no news justifying this price action. I thought CLDC was a typical one-day pump and dump and set out to short it as in previous opportunities.
Yes, I come back to this topic again and again but while my overall trade thesis was ok, the most important thing, my entries and exits were terrible.
CLDC spiked from $2 to $4.6 where it seemed to top out. Then, there was one big red candle right into VWAP. What did I do? I saw this as the “beginning of the end” and shorted CLDC at $3.9. Let´s summarize here, there was a red candle, into support (VWAP) on no significantly higher volume and I shorted right at support. Obviously, CLDC bounced directly and I was under water. How should the entry have looked like? Well, I could have waited for a clear fall through VWAP to short a little later. At least, I would have seen a clear confirmation then. With my entry, I was directly underwater. CLDC tested support at VWAP once more, before it bounced and shortly broke the high of the day. I got stopped out at $4.42. CLDC however, failed to reach no highs. These two green exhaustion candles actually indicated a rather bearish development and presented a great short entry opportunity. Two big red candles followed, and I chased my entry yet again, shorting at $4. What I have said before can be repeated here. I could have shorted the high of the day fail, the definite crack of VWAP or a possible bounce. Instead I chased. With my terrible entry, I chose a stop at $4.4 yet again, even though it had been shown to be not effective just a few minutes before. To show me how stupid this was, I got stopped out just before the next stuff move at $4.4. From this level, CLDC should reach a low of $3.4 within the next 30 minutes.
CLDC however found support and squeezed shorts later in the day again.
On these two trades I basically lost what I had gained in the two sessions before. Thus, even though the losses were not terrible, the sheer stupidity of these entries made me seriously doubt myself for the rest of the week. Terribly entries and terrible stops: this was a clear F grade trading day.
I most likely wrapped up today´s trade and wanted to tell you about them. I traded twice and the result was two wins – pretty nice.
So… let´s just right get into it.
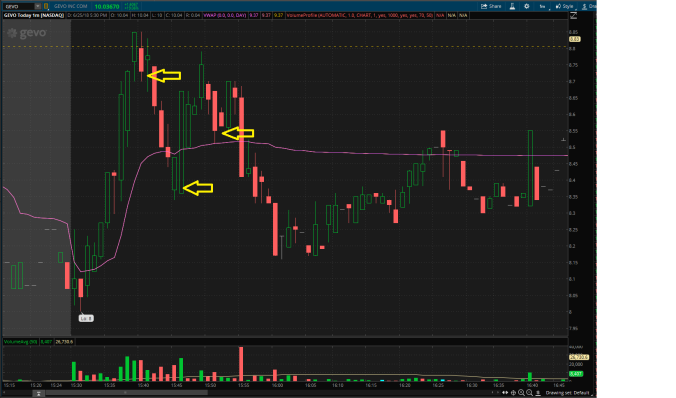
GEVO (Gevo Inc., Basic Materials) was one of the three stocks I was watching. We have encountered this stock already previously. Basically, this is a dilution machine, having traded at more than $60k split adjusted years ago. Last week, it experienced an incredible rise, followed by an equally strong crash. After Friday´s bounce I thought that GEVO was about to continue selling off today.
Coming into the trading day my plan was to see how GEVO reacted at previous support around $8.8. Right out of the gate GEVO climbed towards this anticipated level. When it could not break $8.85 I shorted at 8.73, chasing a little bit. GEVO did pull back after the failure to break through resistance. It fell through VWAP and I covered half my position at $8.35. Instead of further selling off, GEVO bounced and tested the $8.8 level again. Even though it failed, VWAP supported this time and therefore I took my other half off at 8.55. This was early as it turns out. GEVO traded as low as $8.15 in the following minutes.
Later in the day however, GEVO started to squeeze doing this.
All in all, I am quite satisfied with this trade. Relating to my previous comments about the need to improve my Risk/Reward, I am especially happy about this entry close to resistance. The loss given my stop was relatively small compared to my target price (which I did not achieve though).
The second stock that I traded was CADC (China Advanced Construction Materials Group, Inc., Industrial Goods). CADC had been pumped on Friday and was pumped again today. After having pressed the “locate” button on my trading platform about 500 times, I finally was able to locate shares during CADC´s pump.
CADC hit the circuit breaker halt before topping out below $10. When CADC felt very weak, I shorted at $8.75, expecting VWAP to fail. And VWAP did fail. CADC washed to $7.8. I tried to cover half my shares at $7.8-$7.9 yet CADC was very illiquid and I failed in doing so. CADC even crawled back over VWAP. At this point in time, liquidity basically disappeared and even another pump seemed not impossible. When CADC fell again below VWAP without selling off considerably, I covered 2/5 of my position at $8.05 to protect myself. Finally, the bids for CADC where pulled and the stock washed to $7.6. I covered the rest of my shares at $7.7, which was way too early as it turns out.
I am quite satisfied with this trade too. The only thing to criticize in my opinion is my full cover at $7.7. I should have left on at least 1/3 here.
Given these trades I think that I deserve a C+ for today´s discipline and execution.
after no trades on Thursday, I put on three trades today and surprisingly the result was three wins.
Let´s have a look at today´s opportunities.
Because of an analyst upgrade this morning SLNO (Soleno Therapeutics, Inc., Healthcare Sector) gapped up. In general, analyst upgrades are no news worthy of a 20%+ gap. This and the fact that SLNO has very weak fundamentals, made me quite bearish. When the market opened, SLNO tried to spike but failed in doing so. I entered my short at $3.27 when SLNO seemed to fail VWAP. I was a little on the early side but a few minutes later SLNO did fail and washed down to $3 where I covered at $3.02. SLNO bounced and I put my short back on again at $3.23 to cover at $3.04. When SLNO bounced for the third time, I was ready to reshort again. The stock did not reach my anticipated entry level though. After failing crucial support at $3, SLNO went to lows of $2.8. This once more demonstrates that I am not patient enough with my exits. After my second short, I should have left some shares on instead of covering all. In fact, I did expect support to fail. Trading in this way however my risk/reward still is not acceptable.
In the afternoon, chat rooms went crazy and pumped a list of stocks such as CHNR, CADC, CCCR, YECO and CREG (China Recycling Energy Corporation, Industrial Goods Sector). Because I was not able to locate shares for the most extended stocks, I shorted CREG.
CREG reached a high of $2.06 before trading off. When a very bearish candle appeared on the chart, I expected CREG to wash below VWAP and shorted at $1.9. I was too early though. CREG made a final attempt to break the high of the day. When it failed however, it went below VWAP and was not able to reclaim this anymore. I covered at $1.8. As we may see on the chart, CREG reached a low of $1.7. Once more, my failure to exit properly and a bad risk/reward are demonstrated. I should have taken off half into the wash and set a stop on break even above VWAP for the other half.
While I am happy about the three wins today, I have as well realized that I truly need to improve my exits. Without patience, I obtained a D+ today.
today I learned about A+ trade setups. When these setups present themselves, one should size in (which I did not do) and take full advantage of these gifts (which I partly did).
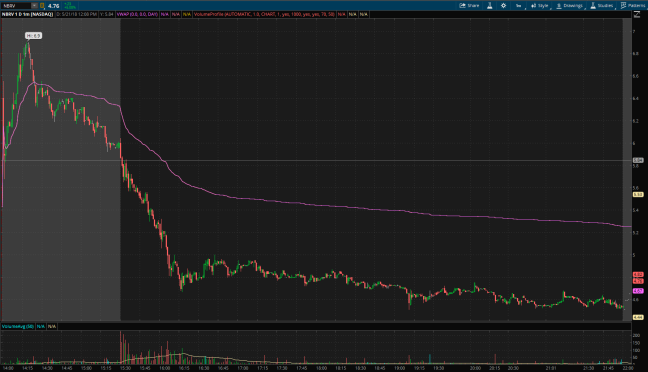
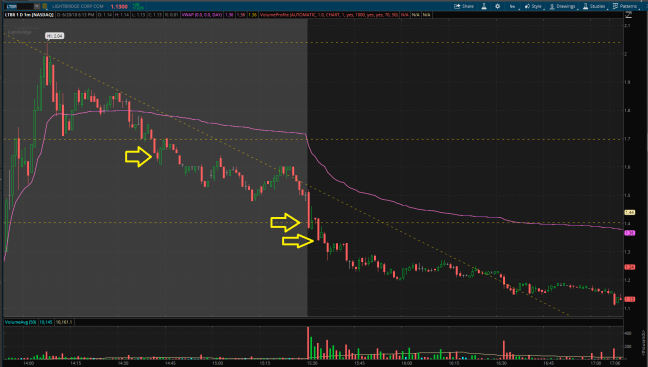
The last few days have been incredible in the small cap world. Therefore, my watchlist was quite full this morning. On the top of this was LTBR (Lightbridge Corporation, Basic Materials Sector). LTBR gapped up more than 70% on patent news (not very impressive ones). I checked the fundamentals and fell more and more in love with the short trade. Firstly, LTBR´s fundamentals are… let´s say they are questionable. Secondly, with a float of well above 20 million shares, the danger of a pump was very limited. Thirdly, there was one incredible fundamental aspect to this trade. In March LTBR entered into an “At-the-Money Issuance Sales Agreement” with an aggregate offering price of up to $50m. This means that shares will be dumped into any spike. From the perspective of demand and supply, supply will greatly outweigh demand. I expected LTBR to sell off all day.
Recently NBRV was a similar setup. This is what happened to NBRV.
My plan was to directly short LTBR when the market opened with a risk of the pre-market high. However, I did not think about the fact that LTBR most likely would not wait until the marked opened to sell off. Instead, after hitting a high of just over $2, LTBR grinded lower and lower during the pre-marked trading session. I was aware of this great opportunity and even though I had promised myself not to enter the trade premarket, I chased LTBR on weakness and shorted 2/3 of the planned size at $1.63. Of course, one may say that the decision to trade pre-market given the circumstances was mental flexibility and necessary in this case and I agree to some extent. However, I did chase weakness here which is not acceptable.
LTBR sold off more until the opening bell rang. At this point it completely lost it, selling off without even bouncing once. I took half my shares off at $1.43 and the other half at $1.33, leaving quite some money on the table. At the time of writing today´s low on LTBR was $1.11.
Today, may chased entry was very bad. This is something I have been working on and I must not do this. Besides this I am very satisfied with today´s trade. However, I would have wished to be in this with bigger size. Today was a grade C.
another day without a trade. Since Monday the market has been nuts while I have been sitting on my hands. Today, I had a plan for NURO (NeuroMetrix, Healthcare Sector). However, my criteria were not met and hence I did not trade.
But let´s have a look at the opportunity. This morning NURO gapped up on news of receiving a $3.8M payment. Given the fact that NURO only had around $6M on their balance sheet, this news do not look quite as bad as other PRs we have seen recently. Nevertheless, I was quite bearish on NURO. Firstly, the magnitude of the gap was not justified in my opinion (from a close of around $1.25 NURO reached a pre-market high of $1.99). Secondly, NURO has been a supreme dilution play for years. This means that the stock sells of until they reverse split the stock. In there, the company raises money from time to time. This process continues and continues, only hurting existing shareholders. Below you can see a monthly chart ranging back years. Here you see that split adjusted, NURO traded at almost $6000 years ago versus around $1 nowadays.
Given my thesis my plan was to wait for a morning wash and then short into the VWAP bounce with a risk of pre-market highs at $2.2. However, NURO directly sold off, thereby not giving me the chance to enter the trade according to my plan. As expected NURO was very weak all day, not spiking above VWAP even once.
I am happy that I followed my plan today which does not mean that my plan was well chosen. Given the pre-market risk and the weakness that NURO had shown before the market open already, I probably should have shorted right at the open. However, this is hindsight now. Since I followed my rules and did not chase, I´ll give myself a C for today.